Thursday, 21 April 2011

Party expectations in England: May 2011. Part Three

South West

[Bristol, North Devon, Plymouth, Taunton Dene, Tewkesbury]

Conservatives Hold 73 Gain 23 Lose 5

Labour Hold 10 Gain 6 Lose 0

LibDem Hold 25 Gain 0 Lose 27

Ind Hold 7 Gain 2 Lose 0

Green Hold 0 Gain 1 Lose 0

Too close to call: 5 seats

South

[Bournemouth, Poole, Southampton, Winchester, Worthing]

Conservatives Hold 85 Gain 15 Lose 4

Labour Hold 9 Gain 9 Lose 0

LibDems Hold 15 Gain 0 Lose 20

Ind Hold 4 Gain 0 Lose 0

Too close to call: 3 seats

Lack of information to make a judgement 3: seats

South East

[Brighton & Hove, Runnymede, Shepway, Watford, Wokingham]

Conservative Hold 82 Gain 8 Lose 9

Labour Hold 14 Gain 10 Lose 0

LibDem Hold 6 Gain 0 Lose 12

Ind Hold 4 Gain 0 Lose 0

Green Hold 13 Gain 3 Lose 0

Too close to call: 4 seats

This completes the list of party expectations of holds, gains and losses.

It is my intention to report on how the parties succeeded or failed in the week following the May local elections.

Wednesday, 20 April 2011

Party expectations in England: May 2011. Part Two

West Midlands

[Birmingham, Lichfield, Telford, Warwick, Wolverhampton]

Conservatives Hold 82 Gain 11 Lose 32

Labour Hold 61 Gain 38 Lose 0

LibDems Hold 9 Gain 0 Lose 16

Ind Hold 9 Gain 0 Lose 1

Others Hold 1 Gain 0 Lose 0

Too close to call: 5 seats

East Midlands

[Broxtowe, Charnwood, Chesterfield, Gedling, Kettering]

Conservatives Hold 63 Gain 7 Lose 39

Labour Hold 47 Gain 66 Lose 0

LibDems Hold 40 Gain 0 Lose 32

Ind Hold 2 Gain 0 Lose 1

Other Hold 0 Gain 0 Lose 1

Too close to call: 2 seats

East

[Boston, Colchester, Lincoln, Luton, Peterborough]

Conservatives Hold 27 Gain 2 Lose 12

Labour Hold 37 Gain 12 Lose 0

LibDems Hold 18 Gain 0 Lose 6

Ind Hold 30 Gain 3 Lose 0

Green Hold 0 Gain 1 Lose 0

Other Hold 1 Gain 0 Lose 0

Too close to call: 1 seat

See previous post for caveats.


Monday, 18 April 2011

Party expectations in England: May 2011.

This is a piece of research on the local elections in May. I have looked at five councils in each of nine regions in England.

I have concluded the number of holds, gains and losses expected by the parties [all of them] in those councils at this stage in the parliamentary cycle and with current [approximate] opinion poll results.

If the parties do better or worse than my projections I will be able to report back in the days after the results are announced.

The councils are not representative - just interesting; some that I would have wished to have used did not present their data in an appropriate fashion whilst others have had local boundary changes.

North East England

[Hartlepool, Newcastle, North Tyneside, Redcar and Cleveland, South Tyneside ]

Conservatives Hold 10 Gain 0 Lose 11

Labour Hold 59 Gain 23 Lose 0

LibDems Hold 25 Gain 0 Lose 6

Ind Hold 4 Gain 0 Lose 6

Too close to call: 4 seats


Yorkshire

[Bradford, Kirklees, Ryedale, Scarborough, Sheffield]

Conservatives Hold 42 Gain 7 Lose 10

Labour Hold 36 Gain 15 Lose 0

LibDems Hold 23 Gain 0 Lose 18

Ind Hold 21 Gain 5 Lose 0

Greens Hold 5 Gain 3 Lose 1

Others Hold 2 Gain 0 Lose 1

Too close to call: 2 seats

North West

[Blackburn & Darwen, Lancaster, Liverpool, Oldham, Sefton]

Conservatives Hold 14 Gain 4 Lose 11

Labour Hold 52 Gain 22 Lose 1

LibDems Hold 21 Gain 0 Lose 15

Ind Hold 14 Gain 4 Lose 4

Green Hold 13 Gain 1 Lose 0

Other Hold 1 Gain 0 Lose 0

Too close to call: 2 seats

The West Midlands, East Midlands, East, South West, South, and South East are to follow.


Bear in mind, some of these figures relate to whole council elections whilst others refer to elections of a third of the council.


Friday, 18 March 2011

Turnout wins and loses elections for the Conservatives

I have been looking at the votes cast in every general election from 1945 until 2010 in an attempt to define patterns which may be useful for predicting future results.

I want to concentrate on two that emerge from the table below.

On each occasion that the Conservative Party failed to poll above its average turnout it lost the election. This happened in 1945, 1950, 1966, Oct 1974, 1997, 2001 and 2005. In 2010 it once again polled below its average and whilst being the largest party failed to receive an absolute majority.

When the Conservatives polled above average it formed an absolute majority in 1951, 1955, 1959, 1970, 1979, 1983, 1992 and 1997. In 1964 the Tories polled above average but lost the election to a paper thin Labour majority. In Feb 1974 it once again polled above average but Edward Heath was forced from office as labour polled less but finished with 4 more seats.


Labour's fortunes have been more mixed. When it polled above average it won six elections - those in 1945, 1950, 1964, 1966, Feb 1974 and 1997 - yet lost four - those in 1951, 1955, 1959 and 1970. When it polled below average it lost four - those in 1979, 1983, 1987 and 1992 - yet won three - those in October 1974, 2001 and 2005. In 2010 it polled below average and was the second party and main opposition to the coalition government.

The second point deals with the question of whether the third party in its various guises dips into the same voting pool as Labour/New Labour.

From the 1983 general election onward Labour and the third party have been fishing from the same voter pool - when Labour's % increases the Liberal [etc.] % falls and when Labour's falls there is an increase in third party %, [shown as z in the table below.] From 1945 until 1979 the picture is more mixed.

Table below [courtesy of Eoin Clarke, The Green Benches] shows the general election results in raw figures for the three main parties with the increase or decrease in % vote from the previous election.


Click on the table to increase size.

Wednesday, 16 March 2011

MPs Pre-selection Connection to Constituencies

Consider All-Women Short-lists and A-Lists


It would seem that being the 'local' candidate in the Conservative Party puts one at a grave disadvantage when it comes to selection.

Monday, 14 March 2011

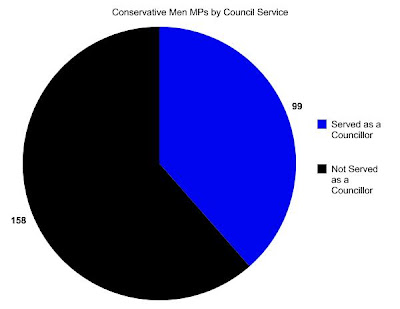
MPs' Council Service by Gender

How useful is Council Service as a vehicle to enter the Commons?


Thursday, 10 March 2011

For Hooded - small government socialism....

So what do I mean by small government socialism?

Its the 'shoe lace principle.'

We teach our kids to tie their laces; if we didn't they might spend the rest of their life asking for help to tie them. We work hard trying to get them to be as self-sufficient as possible. Good international aid does the same thing - the old " don't give a man a fish, teach him how to fish."

So there we have the basic principle. Society has an additional principle - real equality of opportunity - not lip-service. So we take each task and place it at its 'lowest effective and efficient level.' People are expected to clean their own home; if they are unable to do that then we move up a level. Is it practical for the extended family to help? If not then a service needs to be purchased. The purchaser is the individual or family or if financially unable to contribute then the next level up takes on the function - usually the local council.

This principle is applied to everything. If the family wish to home school then they register with a professional educational association who monitor and adjudicate the effectiveness. If the family [see Ivan Illich] are unable to do that then the local community [council] make the arrangements and the community invests [tax] in community education.

Policing, hospitals, social services and a whole range of functions are tested by the principles of self-sufficiency and efficiency and effectiveness. Professional associations monitor progress. There is no profit motive in any of the services as they are collaborative and for the benefit of the community.

Regional and national governments are left only with the issues that need to be dealt with on a national level. And nothing else. All matters that have been dealt with at the local level must not be duplicated at the national level.

The national government prints [and distributes to the national public sector] money and defends [broadest sense] the population. Each band of service taxes only for the issue for which they are responsible.

So all matters are organised from the bottom up. Communities send their representatives up a level or so to make decisions at the next level. Representatives must be of that community, living in the community and representing its needs and aspirations.

The key factor is that national government keeps its nose out of all matters other than to offer broad guidelines on quality of anticipated outcomes. Non-governmental professional associations offer advice on improvement, but the decisions on all matters relating to the community are taken by the community.

Levels of community in order of import.

1 Individual 2 Family 3 Immediate local community 4 City 5 County [if really necessary] 6 Region [if necessary] 7 National government.

This argument is not concerned with the broader matter of international affairs.

Our current governmental system has managed to invert the importance principle and has a befuddled view of the equality of opportunity principle.

Self-sufficiency of individuals, families and communities is essential to growth and development; principles of fairness are essential for individual and community happiness.

Why socialism? Throughout there is a commitment by 'society - the nation state' to help those who can to help themselves and to support those who can't. In so many societies the concern for the whole community has been suppressed by the one-eyed greed of the individual. Therefore capitalism needs to be regulated; the means of the production do not need to be in the hands of the government. The government needs to be able to balance capital and labour - or at least attempt to.

Hope this has been helpful. All of my political attitudes are judged against this model.


Monday, 7 March 2011

For International Women's Day - MPs' Tertiary Education by Gender

Women MPs and the University Route to the Commons


Sunday, 6 March 2011

MPs' Secondary Education by Gender

Have comprehensive schools worked for women?


Thursday, 3 March 2011

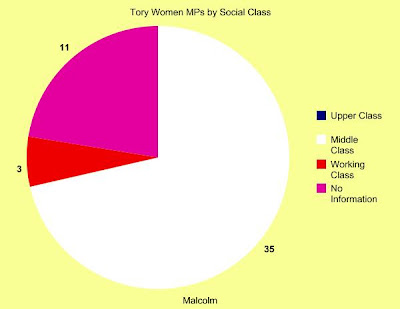
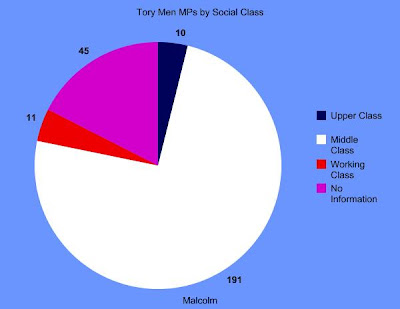
MPs' Social Class by Gender

What are the opportunities for working class women to enter parliament?


Friday, 25 February 2011

Gender Issues

In March I intend to look closely at how gender issues relate directly to the other criteria in my surveys; I shall once again use pie charts and will refrain from commenting on what they show.

This research may give glimpses of the paths that women have taken to reach the Commons; I would also like to research the effect of the Conservative 'A List' and the all-women shorts lists for the Labour Party.

I hope the research proves of value to those who manage to see it.

Thursday, 24 February 2011

MPs with Constituency Connections before Original Selection

So which party has the most Parachutes?


Would you prefer a locally connected MP?

Wednesday, 23 February 2011

Council Service of MPs

Is council service a grounding for prospective MPs?


Does serving as a councillor allow MPs to have a better idea of how national policies will affect local services?

Tuesday, 22 February 2011

MPs by Tertiary Education

How many British MPs paid for their University education?


Of the MPs that provide information 87.5% completed University degrees, 12.5% did not.

Monday, 21 February 2011

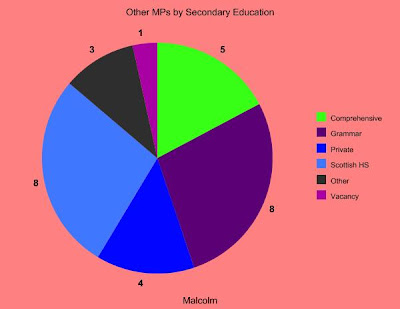
MPs by Secondary Education

So does going to a 'good' school count?


There are now more than 2,500 independent schools in the UK, educating some 615,000 children,or some 7% of children throughout the country. Wiki.